 20 Year Home Loan Calculator
This calculator defaults to a 20-year loan term and figures monthly mortgage payments based on the principal amount borrowed, the length of the loan and the annual interest rate. This calculator will also figure your total monthly mortgage payment which will include your property tax, property insurance and PMI payments. Then, once you have computed the monthly payment, click on the "Create Amortization Schedule" button to create a report you can print out.
For your convenience current Columbus 20-year mortgage rates are published below.
Current 20-Year Columbus Mortgage Rates
We publish current Columbus mortgage rates. OH homebuyers and refinancers can use the filters at the top of the table to see the monthly payments and rates availble for their loans.
Things to Consider Before Choosing a 20-Year Fixed-Rate Mortgage

Shopping around for the right mortgage can get really taxing. Even if it’s not your first time to buy a house, you still have to do a lot of research. Apart from qualifying for a loan, you have to think about favorable rates and terms.
The most common loan option buyers take is a 30-year fixed-rate mortgage. However, there are other options out there than can shorten your term. While people usually take a 15-year term, did you know you can obtain a 20 year-fixed rate loan?
Read here to learn more about 20-year fixed rate mortgages. We’ll let you know when it’s advantageous to choose this loan, and what it’s commonly used for. With this guide, we hope you can decide whether a 20-year fixed mortgage works for you.

What is a 20-Year Fixed-Rate Mortgage?
A 20-year fixed-rate mortgage is a type of financing with a locked interest rate. This means your loan keeps the same rate and monthly payments for 20 years. Except for mortgage insurance and taxes, your payment amount does not change.
Compared to 30-year loans, monthly payments in a 20-year fixed mortgage will be slightly higher. But on the positive side, your payments will not be as costly as 15 or 10-year terms. Likewise, your interest charges will still be reduced if you take a 20-year term over a 30-year mortgage. After all, you’re still slashing 10-years worth of interest payments.
Homebuyers can find 20-year fixed-rate loans when they apply for government-secured mortgages or conventional real estate loans. And while it’s used as a loan purchase option, buyers also take 20-year fixed mortgages to refinance their homes.
Refinancing is the process of obtaining a new mortgage to replace your existing loan. Homebuyers strategically do this to change their mortgage to a different one with favorable terms. This includes obtaining lower interest rates and shorter repayment periods. To reap larger savings, it’s ideal to refinance early into the loan term.
Preparing for Refinancing
Homeowners who plan on refinancing must meet a minimum credit score of 620 to qualify. To secure competitive rates, work on increasing your credit score. Note that borrowers with a credit score of 740 usually receive the best rates.
Finally, refinancing usually costs between 2 to 6 percent of your loan. To compensate for this expense, you must refinance only when rates are low. It’s best to refinance when rates are 2 percentage points lower to maximize your savings.
Types of Mortgage That Offer 20-Year Fixed-Rate Loans
If you’re planning to purchase a home, you will find 20-year fixed mortgages in the following types of loans:
Conforming Conventional Loans
Conventional loans are a type of mortgage which is not federally-backed by the government. They are offered by private mortgage companies, banks, and credit unions. Conventional loans are appropriate for buyers with a good credit score, high salary, and a steady source of income. Only borrowers with credit scores of 650 and up are eligible for this loan option. Apart from the 20-year fixed-rate loan, conventional loans are available in many terms, including the following:
- 10-Year Fixed-Rate Mortgage
- 15-Year Fixed-Rate Mortgage
- 25-Year Fixed-Rate Mortgage
- 30-Year Fixed-Rate Mortgage
- 30-Year Adjustable-Rate Mortgage
A conventional mortgage is considered a conforming loan when it falls under the financing limits set by the Federal Housing Finance Agency (FHFA). Under the 2008 Housing and Economic Recovery Act, conforming limits must be adjusted annually to accurately reflect changes in market home price. For instance, the baseline U.S. continental loan limit is set at $647,200 in 2022. Beyond this limit, a mortgage is classified as a non-conforming conventional loan, also known in as a jumbo loan. The limit in high-cost areas is 150% of the baseline.
Private Mortgage Insurance (PMI)
Buyers are required to pay a private mortgage insurance if they make a downpayment less than 20 percent of the home price. This protects the lender in case you have trouble making payments. It’s a premium that’s usually added to your monthly payment. In some cases, it is paid in closing as a one-time upfront premium.
PMI is automatically canceled once your mortgage balance is 78 percent of your home’s price. This premium is also removed if you’ve paid half of the payments in your amortization schedule.
Non-Conforming Conventional Loans
Conventional loans that do not adhere to conforming limits are called non-conforming conventional loans. Because these loans surpass the conforming limit, they are also called a “jumbo mortgage.” Jumbo mortgages are offered by private lenders such as banks, mortgage companies, and credit unions.
Non-conforming loans are only obtained by borrowers with excellent credit scores and high income. These are used to purchase more expensive property. To qualify for a jumbo loan, you must have a credit score of 700 and above.
Government-backed Mortgage Loans
Government-sponsored loans are federally funded to help majority of buyers afford a home. This is suited for low to moderate-income buyers who often have low credit scores. You can qualify for a government-backed mortgage (FHA loan) if your credit score is 500, along with a 10 percent downpayment. Other government-sponsored mortgages like USDA loans and VA loans offer zero downpayment options.
The following are examples of government-backed mortgages:
- The Federal Housing Administration backs FHA loans
- The U.S. Department of Agriculture backs USDA loans *
- The U.S. Department of Veterans Affairs backs VA loans
- Conventional loans are not directly backed by the Federal government. Instead they are typically backed by Fannie Mae & Freddie Mac, which are government sponsored entities (GSEs).
*Check If You Qualify for USDA Refinancing
Homeowners with 30-year fixed mortgages are eligible for USDA streamlined assist refinance program. To qualify, your home must be a primary residence in a USDA area. Furthermore, borrowers must have a record of 12 consecutive on-time payments. Check with an approved USDA lender to see if you can apply.
On the downside, borrowers with 20 or 15-year loans do not qualify for this program. If you want to refinance, you’ll have to look for another lender.
Mortgage Insurance Premium (MIP)
Government-sponsored loans like FHA and USDA require a mortgage insurance premium if your loan balance is 80 percent of the house’s value. MIP is around 0.80 to 0.85 percent of a home loan. This cannot be removed and must be paid for the entire life of the loan.
MIP compensates for the low downpayment under FHA, and the zero downpayment option for USDA loans. This premium is included in your monthly payment, which increases the overall cost of your mortgage.
Why Do Buyers Obtain a 20-Year Fixed-Rate Home Loan?

A 20-year fixed-rate mortgage provides buyers with an alternative to 30-year loans. While 30-year fixed-rate options dominate the market, people still look for a shorter term. A more common option is a 15-year fixed mortgage. However, this is steep for consumers who cannot afford higher monthly payments. Furthermore, borrowers who try to obtain 10 or 15-year mortgages are often limited to a smaller loan amount.
The good news? You can secure a shorter term even if you can’t afford a 15-year fixed-rate loan. Twenty-year fixed mortgages have more affordable monthly payments compared to a 15-year term. If you can take this type of mortgage, you don’t have to worry about refinancing to a shorter term. Likewise, some buyers refinance to a 20-year term after 2 or 3 years into a 30-year mortgage.
In a Washington Post article featuring mortgage broker Jerry Robinson, he stated that more buyers should seriously consider a 20-year fixed mortgage. Robinson is the owner of First Choice Mortgage Co. in Idaho:

“There are quite a few reasons I feel more people should refinance or purchase into a 20-year fixed-rate mortgage rather than looking at a 30-year or a 15-year fixed rate mortgage..”
Jerry Robinson, CEO, First Choice Mortgage Co.
Among those reasons are affordable payments compared to 15-year terms and substantial interest savings over a 30-year term. He also mentioned how it can help eliminate your debt by your 60s so you can retire comfortably without worries.

Early Mortgage Payment
A shorter term allows you to pay off your loan faster. It helps get rid of costly interest charges that should go towards savings and emergency funds. Early debt payment is beneficial so you can save for retirement, send your children to college, or invest in worthwhile ventures. Plus, you’ll gain equity faster, which means you’ll own your home earlier by 10 years.
Now let’s compare interest savings. Below is a table which shows how much you’ll spend on interests between a 20-year fixed mortgage, a 15-year fixed loan, and 30-year fixed-rate mortgage.
Loan Amount: $300,000
| Loan Term | 30-Year FRM | 20-Year FRM | 15-Year FRM |
|---|---|---|---|
| Interest rate (APR) | 3.8% | 3.65% | 3.4% |
| Monthly payment | $1,397.87 | $1,763.09 | $2,129.95 |
| Total interest | $203,233.94 | $123,141.98 | $83,390.21 |
Based on the example above, you’ll notice how the monthly payment increases with a shorter loan term. The 20-year fixed mortgage lies in the middle, with a higher monthly payment of $1,763.09 compared to $1,397.87 on a 30-year term. That’s an additional $365.22 on monthly payments. When it comes to a 15-year term, the monthly payment is $2,129.95, which is $732.08 more expensive than a 30-year loan. At that cost, many buyers are likely not able to afford the loan.
With a 20-year fixed-rate loan, you’ll be able to save a total of $80, 091.96 on interest charges. Though it does not cut your interest payments in half, you still slash 10-years of interest payments from your mortgage. However, if you can afford a 15-year fixed-rate loan, you will save $119,843.73 on total interest costs. That’s $119,843.73 more interest savings compared to a 20-year fixed term.
Short Payment Terms You Can Afford
Homebuyers who cannot afford a 15-year fixed-rate loan should consider a 20-year fixed-rate mortgage. This is the next best option if you don’t want to get tied into a 30-year loan. You may also refinance into a shorter term after a couple of years, preferably when interest rates are much lower.
The Pros and Cons of a 20-Year Fixed-Rate Mortgage
Choosing a 20-year mortgage saves a considerable amount of interest over a 30-year term. You also get to pay down your debt 10-years sooner. Some homeowners also consider refinancing to a 20-year term if they cannot afford a shorter payment period. It’s worth saving a couple of years even if it does not shorten your payment time in half.
However, there are a couple of disadvantages to consider. One, you don’t get to save as much compared to a shorter term. More homeowners still opt to refinance from a 30-year fixed mortgage and to a 15-year fixed-rate loan.
Another is limited purchasing power. A portion of your income cannot go towards your savings and emergency funds. It can be tight on your budget especially if you have emergencies. Furthermore, even with a more affordable monthly payment, you may still not qualify for a larger loan amount. This can spell the difference between buying your dream home or settling for a more affordable property. But when this happens, inquire with another lender. You may still qualify for the amount you need.
Here is a table that breaks down the pros and cons of choosing a 20-year fixed mortgage:
| Pros | Cons |
|---|---|
| Lower monthly payment compared to a 30-year fixed mortgage | Higher monthly payment compared to a 30-year fixed-rate mortgage |
| Slightly lower interest rate compared to a 30-year fixed-rate loan. Example: In July 8, 2020 – 20-year fixed mortgage rate: 3.082% APR; 30-year fixed mortgage rate: 3.190% APR. | Higher interest rate compared to a 15-year fixed-rate mortgage. Example: In July 8, 2020 – 20-year fixed mortgage rate: 3.082% APR; 15-year fixed mortgage rate: 2.726% APR. |
| Save more on overall interest compared to a 30-year fixed mortgage | Save less on overall interest compared to a shorter term |
| No increasing payments – the fixed rate ensures your monthly interest and principal payments remain the same | Higher payments limit your purchasing power, less savings |
| Allows you to qualify for a larger loan compared to a 15-year fixed mortgage | Higher payments mean you might not qualify for a larger loan amount |
How Popular are 20-Year Fixed Mortgages?
As you’ve probably guessed, 20-year fixed rate loans are not the most popular type of mortgage in the market. Because it has higher monthly payments compared to a 30-year fixed-rate loan, it’s not as attractive to buyers. This is likely true among borrowers with lower credit scores and smaller incomes. These people have a hard time getting approved for a loan. Moreover, many of them may only have the option to afford a 30-year mortgage.
In April 2020, the market share for 30-year fixed-rate mortgages reached 77 percent, according to the Urban Institute. This data is sourced from the June 2020 Housing Finance at a Glance: A Monthly Chartbook. It shows how 30-year fixed-rate loans continue to overtake a large portion of the housing market. Below is a graph of mortgage market shares from 2000 to 2020.
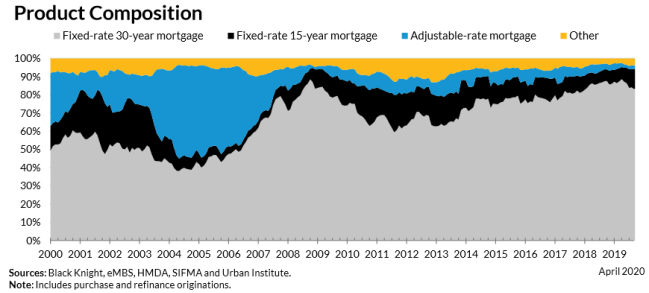
In second place comes 15-year fixed-rate loans, which accounted for 14.2 percent of new loan originations in April 2020. According to the report, homeowners predominantly use 15-year fixed terms as a refinancing tool. It’s a viable option for people who can afford to shorten their repayment term and take advantage of lower interest rates.
In third place comes adjustable-rate mortgages (ARM) which, accounted for 2.7 percent of new loan originations in April 2020. ARMs take a smaller market share because it’s suited for borrowers with higher credit scores and stable incomes. Changes in interest rates may increase monthly payments, which is not a risk most borrowers would take.
Finally, about 6.1 percent of new loan originations in April 2020 were classified under “Other.” This share likely includes 20-year fixed rate loans, 10-year fixed loans, and 25-year mortgages.
Loan Amortization

A 20-year fixed-rate loan adheres to a traditional amortization schedule. An amortization schedule is a complete table that shows the number of periodic payments you must make to pay-off your mortgage. It is based on your loan amount and your assigned interest rate. Your amortization schedule details how much of your payment is applied to the your loan’s principal and interest.
- Principal – Also known as the outstanding balance, the principal is the amount you borrowed from your mortgage lender. It also reflects how much you still owe your lender after making several payments.
- Interest – This is the cost lender charge to provide your loan. Your outstanding balance generates greater interest the longer it takes to decrease it.
In a traditional amortization schedule, a larger portion of your payment goes toward the interest during the first years of the term. Towards the later years, it gradually shifts. At which point a greater portion of your payments go toward paying your principal. As long as you don’t miss payments, your loan should be paid off within 20 years.
Committing to monthly payments for 20 years is a serious task. You must stay on top of your finances to make payments on time. Apart from your principal and interest payments, don’t forget mortgage taxes and insurance fees. When taken together, these costs are known as PITI or Principal, Interest, Taxes, and Insurance. Once you know your PITI, you can determine the total cost of your monthly mortgage payments.
Savings Tip!
Want to save on interest and shave a few years from your loan? Make extra payments toward your principal. Added payments offer the most benefits during the first years of your loan. This helps reduce your principal, which consequently lowers your interest charges. It also removes few months or years off your mortgage. However, check if your mortgage has prepayment penalty. The savings won’t be worth it if you need to pay costly fees.
Need an amortization schedule for a 20-year fixed-rate term? Use our calculator above.
The following table shows the amortization on a 20-year $200,000 home loan at 3.0% APR for a loan that begins on the last day of this year. On this example loan, payments being on January 31, 2025 for a loan originated on December 31, 2024.
You can generate a similar printable table using the above calculator by clicking on the [Inline Schedule] button. If you would like to print out your amortization schedule please click on the [Printable Schedule] button.
| PMNT | Date | Payment | Principal | Interest | Balance |
|---|---|---|---|---|---|
| 1 | Jan 31, 2025 | $1,109.20 | $609.20 | $500.00 | $199,390.80 |
| 2 | Feb 28, 2025 | $1,109.20 | $610.72 | $498.48 | $198,780.08 |
| 3 | Mar 31, 2025 | $1,109.20 | $612.25 | $496.95 | $198,167.83 |
| 4 | Apr 30, 2025 | $1,109.20 | $613.78 | $495.42 | $197,554.05 |
| 5 | May 31, 2025 | $1,109.20 | $615.31 | $493.89 | $196,938.74 |
| 6 | Jun 30, 2025 | $1,109.20 | $616.85 | $492.35 | $196,321.89 |
| 7 | Jul 31, 2025 | $1,109.20 | $618.40 | $490.80 | $195,703.49 |
| 8 | Aug 31, 2025 | $1,109.20 | $619.94 | $489.26 | $195,083.55 |
| 9 | Sep 30, 2025 | $1,109.20 | $621.49 | $487.71 | $194,462.06 |
| 10 | Oct 31, 2025 | $1,109.20 | $623.04 | $486.16 | $193,839.02 |
| 11 | Nov 30, 2025 | $1,109.20 | $624.60 | $484.60 | $193,214.42 |
| 12 | Dec 31, 2025 | $1,109.20 | $626.16 | $483.04 | $192,588.26 |
| Year 2025 | $13,310.40 | $7,411.74 | $5,898.66 | $192,588.26 | |
| 13 | Jan 31, 2026 | $1,109.20 | $627.73 | $481.47 | $191,960.53 |
| 14 | Feb 28, 2026 | $1,109.20 | $629.30 | $479.90 | $191,331.23 |
| 15 | Mar 31, 2026 | $1,109.20 | $630.87 | $478.33 | $190,700.36 |
| 16 | Apr 30, 2026 | $1,109.20 | $632.45 | $476.75 | $190,067.91 |
| 17 | May 31, 2026 | $1,109.20 | $634.03 | $475.17 | $189,433.88 |
| 18 | Jun 30, 2026 | $1,109.20 | $635.62 | $473.58 | $188,798.26 |
| 19 | Jul 31, 2026 | $1,109.20 | $637.20 | $472.00 | $188,161.06 |
| 20 | Aug 31, 2026 | $1,109.20 | $638.80 | $470.40 | $187,522.26 |
| 21 | Sep 30, 2026 | $1,109.20 | $640.39 | $468.81 | $186,881.87 |
| 22 | Oct 31, 2026 | $1,109.20 | $642.00 | $467.20 | $186,239.87 |
| 23 | Nov 30, 2026 | $1,109.20 | $643.60 | $465.60 | $185,596.27 |
| 24 | Dec 31, 2026 | $1,109.20 | $645.21 | $463.99 | $184,951.06 |
| Year 2026 | $13,310.40 | $7,637.20 | $5,673.20 | $184,951.06 | |
| 25 | Jan 31, 2027 | $1,109.20 | $646.82 | $462.38 | $184,304.24 |
| 26 | Feb 28, 2027 | $1,109.20 | $648.44 | $460.76 | $183,655.80 |
| 27 | Mar 31, 2027 | $1,109.20 | $650.06 | $459.14 | $183,005.74 |
| 28 | Apr 30, 2027 | $1,109.20 | $651.69 | $457.51 | $182,354.05 |
| 29 | May 31, 2027 | $1,109.20 | $653.31 | $455.89 | $181,700.74 |
| 30 | Jun 30, 2027 | $1,109.20 | $654.95 | $454.25 | $181,045.79 |
| 31 | Jul 31, 2027 | $1,109.20 | $656.59 | $452.61 | $180,389.20 |
| 32 | Aug 31, 2027 | $1,109.20 | $658.23 | $450.97 | $179,730.97 |
| 33 | Sep 30, 2027 | $1,109.20 | $659.87 | $449.33 | $179,071.10 |
| 34 | Oct 31, 2027 | $1,109.20 | $661.52 | $447.68 | $178,409.58 |
| 35 | Nov 30, 2027 | $1,109.20 | $663.18 | $446.02 | $177,746.40 |
| 36 | Dec 31, 2027 | $1,109.20 | $664.83 | $444.37 | $177,081.57 |
| Year 2027 | $13,310.40 | $7,869.49 | $5,440.91 | $177,081.57 | |
| 37 | Jan 31, 2028 | $1,109.20 | $666.50 | $442.70 | $176,415.07 |
| 38 | Feb 28, 2028 | $1,109.20 | $668.16 | $441.04 | $175,746.91 |
| 39 | Mar 31, 2028 | $1,109.20 | $669.83 | $439.37 | $175,077.08 |
| 40 | Apr 30, 2028 | $1,109.20 | $671.51 | $437.69 | $174,405.57 |
| 41 | May 31, 2028 | $1,109.20 | $673.19 | $436.01 | $173,732.38 |
| 42 | Jun 30, 2028 | $1,109.20 | $674.87 | $434.33 | $173,057.51 |
| 43 | Jul 31, 2028 | $1,109.20 | $676.56 | $432.64 | $172,380.95 |
| 44 | Aug 31, 2028 | $1,109.20 | $678.25 | $430.95 | $171,702.70 |
| 45 | Sep 30, 2028 | $1,109.20 | $679.94 | $429.26 | $171,022.76 |
| 46 | Oct 31, 2028 | $1,109.20 | $681.64 | $427.56 | $170,341.12 |
| 47 | Nov 30, 2028 | $1,109.20 | $683.35 | $425.85 | $169,657.77 |
| 48 | Dec 31, 2028 | $1,109.20 | $685.06 | $424.14 | $168,972.71 |
| Year 2028 | $13,310.40 | $8,108.86 | $5,201.54 | $168,972.71 | |
| 49 | Jan 31, 2029 | $1,109.20 | $686.77 | $422.43 | $168,285.94 |
| 50 | Feb 28, 2029 | $1,109.20 | $688.49 | $420.71 | $167,597.45 |
| 51 | Mar 31, 2029 | $1,109.20 | $690.21 | $418.99 | $166,907.24 |
| 52 | Apr 30, 2029 | $1,109.20 | $691.93 | $417.27 | $166,215.31 |
| 53 | May 31, 2029 | $1,109.20 | $693.66 | $415.54 | $165,521.65 |
| 54 | Jun 30, 2029 | $1,109.20 | $695.40 | $413.80 | $164,826.25 |
| 55 | Jul 31, 2029 | $1,109.20 | $697.13 | $412.07 | $164,129.12 |
| 56 | Aug 31, 2029 | $1,109.20 | $698.88 | $410.32 | $163,430.24 |
| 57 | Sep 30, 2029 | $1,109.20 | $700.62 | $408.58 | $162,729.62 |
| 58 | Oct 31, 2029 | $1,109.20 | $702.38 | $406.82 | $162,027.24 |
| 59 | Nov 30, 2029 | $1,109.20 | $704.13 | $405.07 | $161,323.11 |
| 60 | Dec 31, 2029 | $1,109.20 | $705.89 | $403.31 | $160,617.22 |
| Year 2029 | $13,310.40 | $8,355.49 | $4,954.91 | $160,617.22 | |
| 61 | Jan 31, 2030 | $1,109.20 | $707.66 | $401.54 | $159,909.56 |
| 62 | Feb 28, 2030 | $1,109.20 | $709.43 | $399.77 | $159,200.13 |
| 63 | Mar 31, 2030 | $1,109.20 | $711.20 | $398.00 | $158,488.93 |
| 64 | Apr 30, 2030 | $1,109.20 | $712.98 | $396.22 | $157,775.95 |
| 65 | May 31, 2030 | $1,109.20 | $714.76 | $394.44 | $157,061.19 |
| 66 | Jun 30, 2030 | $1,109.20 | $716.55 | $392.65 | $156,344.64 |
| 67 | Jul 31, 2030 | $1,109.20 | $718.34 | $390.86 | $155,626.30 |
| 68 | Aug 31, 2030 | $1,109.20 | $720.13 | $389.07 | $154,906.17 |
| 69 | Sep 30, 2030 | $1,109.20 | $721.93 | $387.27 | $154,184.24 |
| 70 | Oct 31, 2030 | $1,109.20 | $723.74 | $385.46 | $153,460.50 |
| 71 | Nov 30, 2030 | $1,109.20 | $725.55 | $383.65 | $152,734.95 |
| 72 | Dec 31, 2030 | $1,109.20 | $727.36 | $381.84 | $152,007.59 |
| Year 2030 | $13,310.40 | $8,609.63 | $4,700.77 | $152,007.59 | |
| 73 | Jan 31, 2031 | $1,109.20 | $729.18 | $380.02 | $151,278.41 |
| 74 | Feb 28, 2031 | $1,109.20 | $731.00 | $378.20 | $150,547.41 |
| 75 | Mar 31, 2031 | $1,109.20 | $732.83 | $376.37 | $149,814.58 |
| 76 | Apr 30, 2031 | $1,109.20 | $734.66 | $374.54 | $149,079.92 |
| 77 | May 31, 2031 | $1,109.20 | $736.50 | $372.70 | $148,343.42 |
| 78 | Jun 30, 2031 | $1,109.20 | $738.34 | $370.86 | $147,605.08 |
| 79 | Jul 31, 2031 | $1,109.20 | $740.19 | $369.01 | $146,864.89 |
| 80 | Aug 31, 2031 | $1,109.20 | $742.04 | $367.16 | $146,122.85 |
| 81 | Sep 30, 2031 | $1,109.20 | $743.89 | $365.31 | $145,378.96 |
| 82 | Oct 31, 2031 | $1,109.20 | $745.75 | $363.45 | $144,633.21 |
| 83 | Nov 30, 2031 | $1,109.20 | $747.62 | $361.58 | $143,885.59 |
| 84 | Dec 31, 2031 | $1,109.20 | $749.49 | $359.71 | $143,136.10 |
| Year 2031 | $13,310.40 | $8,871.49 | $4,438.91 | $143,136.10 | |
| 85 | Jan 31, 2032 | $1,109.20 | $751.36 | $357.84 | $142,384.74 |
| 86 | Feb 28, 2032 | $1,109.20 | $753.24 | $355.96 | $141,631.50 |
| 87 | Mar 31, 2032 | $1,109.20 | $755.12 | $354.08 | $140,876.38 |
| 88 | Apr 30, 2032 | $1,109.20 | $757.01 | $352.19 | $140,119.37 |
| 89 | May 31, 2032 | $1,109.20 | $758.90 | $350.30 | $139,360.47 |
| 90 | Jun 30, 2032 | $1,109.20 | $760.80 | $348.40 | $138,599.67 |
| 91 | Jul 31, 2032 | $1,109.20 | $762.70 | $346.50 | $137,836.97 |
| 92 | Aug 31, 2032 | $1,109.20 | $764.61 | $344.59 | $137,072.36 |
| 93 | Sep 30, 2032 | $1,109.20 | $766.52 | $342.68 | $136,305.84 |
| 94 | Oct 31, 2032 | $1,109.20 | $768.44 | $340.76 | $135,537.40 |
| 95 | Nov 30, 2032 | $1,109.20 | $770.36 | $338.84 | $134,767.04 |
| 96 | Dec 31, 2032 | $1,109.20 | $772.28 | $336.92 | $133,994.76 |
| Year 2032 | $13,310.40 | $9,141.34 | $4,169.06 | $133,994.76 | |
| 97 | Jan 31, 2033 | $1,109.20 | $774.21 | $334.99 | $133,220.55 |
| 98 | Feb 28, 2033 | $1,109.20 | $776.15 | $333.05 | $132,444.40 |
| 99 | Mar 31, 2033 | $1,109.20 | $778.09 | $331.11 | $131,666.31 |
| 100 | Apr 30, 2033 | $1,109.20 | $780.03 | $329.17 | $130,886.28 |
| 101 | May 31, 2033 | $1,109.20 | $781.98 | $327.22 | $130,104.30 |
| 102 | Jun 30, 2033 | $1,109.20 | $783.94 | $325.26 | $129,320.36 |
| 103 | Jul 31, 2033 | $1,109.20 | $785.90 | $323.30 | $128,534.46 |
| 104 | Aug 31, 2033 | $1,109.20 | $787.86 | $321.34 | $127,746.60 |
| 105 | Sep 30, 2033 | $1,109.20 | $789.83 | $319.37 | $126,956.77 |
| 106 | Oct 31, 2033 | $1,109.20 | $791.81 | $317.39 | $126,164.96 |
| 107 | Nov 30, 2033 | $1,109.20 | $793.79 | $315.41 | $125,371.17 |
| 108 | Dec 31, 2033 | $1,109.20 | $795.77 | $313.43 | $124,575.40 |
| Year 2033 | $13,310.40 | $9,419.36 | $3,891.04 | $124,575.40 | |
| 109 | Jan 31, 2034 | $1,109.20 | $797.76 | $311.44 | $123,777.64 |
| 110 | Feb 28, 2034 | $1,109.20 | $799.76 | $309.44 | $122,977.88 |
| 111 | Mar 31, 2034 | $1,109.20 | $801.76 | $307.44 | $122,176.12 |
| 112 | Apr 30, 2034 | $1,109.20 | $803.76 | $305.44 | $121,372.36 |
| 113 | May 31, 2034 | $1,109.20 | $805.77 | $303.43 | $120,566.59 |
| 114 | Jun 30, 2034 | $1,109.20 | $807.78 | $301.42 | $119,758.81 |
| 115 | Jul 31, 2034 | $1,109.20 | $809.80 | $299.40 | $118,949.01 |
| 116 | Aug 31, 2034 | $1,109.20 | $811.83 | $297.37 | $118,137.18 |
| 117 | Sep 30, 2034 | $1,109.20 | $813.86 | $295.34 | $117,323.32 |
| 118 | Oct 31, 2034 | $1,109.20 | $815.89 | $293.31 | $116,507.43 |
| 119 | Nov 30, 2034 | $1,109.20 | $817.93 | $291.27 | $115,689.50 |
| 120 | Dec 31, 2034 | $1,109.20 | $819.98 | $289.22 | $114,869.52 |
| Year 2034 | $13,310.40 | $9,705.88 | $3,604.52 | $114,869.52 | |
| 121 | Jan 31, 2035 | $1,109.20 | $822.03 | $287.17 | $114,047.49 |
| 122 | Feb 28, 2035 | $1,109.20 | $824.08 | $285.12 | $113,223.41 |
| 123 | Mar 31, 2035 | $1,109.20 | $826.14 | $283.06 | $112,397.27 |
| 124 | Apr 30, 2035 | $1,109.20 | $828.21 | $280.99 | $111,569.06 |
| 125 | May 31, 2035 | $1,109.20 | $830.28 | $278.92 | $110,738.78 |
| 126 | Jun 30, 2035 | $1,109.20 | $832.35 | $276.85 | $109,906.43 |
| 127 | Jul 31, 2035 | $1,109.20 | $834.43 | $274.77 | $109,072.00 |
| 128 | Aug 31, 2035 | $1,109.20 | $836.52 | $272.68 | $108,235.48 |
| 129 | Sep 30, 2035 | $1,109.20 | $838.61 | $270.59 | $107,396.87 |
| 130 | Oct 31, 2035 | $1,109.20 | $840.71 | $268.49 | $106,556.16 |
| 131 | Nov 30, 2035 | $1,109.20 | $842.81 | $266.39 | $105,713.35 |
| 132 | Dec 31, 2035 | $1,109.20 | $844.92 | $264.28 | $104,868.43 |
| Year 2035 | $13,310.40 | $10,001.09 | $3,309.31 | $104,868.43 | |
| 133 | Jan 31, 2036 | $1,109.20 | $847.03 | $262.17 | $104,021.40 |
| 134 | Feb 28, 2036 | $1,109.20 | $849.15 | $260.05 | $103,172.25 |
| 135 | Mar 31, 2036 | $1,109.20 | $851.27 | $257.93 | $102,320.98 |
| 136 | Apr 30, 2036 | $1,109.20 | $853.40 | $255.80 | $101,467.58 |
| 137 | May 31, 2036 | $1,109.20 | $855.53 | $253.67 | $100,612.05 |
| 138 | Jun 30, 2036 | $1,109.20 | $857.67 | $251.53 | $99,754.38 |
| 139 | Jul 31, 2036 | $1,109.20 | $859.81 | $249.39 | $98,894.57 |
| 140 | Aug 31, 2036 | $1,109.20 | $861.96 | $247.24 | $98,032.61 |
| 141 | Sep 30, 2036 | $1,109.20 | $864.12 | $245.08 | $97,168.49 |
| 142 | Oct 31, 2036 | $1,109.20 | $866.28 | $242.92 | $96,302.21 |
| 143 | Nov 30, 2036 | $1,109.20 | $868.44 | $240.76 | $95,433.77 |
| 144 | Dec 31, 2036 | $1,109.20 | $870.62 | $238.58 | $94,563.15 |
| Year 2036 | $13,310.40 | $10,305.28 | $3,005.12 | $94,563.15 | |
| 145 | Jan 31, 2037 | $1,109.20 | $872.79 | $236.41 | $93,690.36 |
| 146 | Feb 28, 2037 | $1,109.20 | $874.97 | $234.23 | $92,815.39 |
| 147 | Mar 31, 2037 | $1,109.20 | $877.16 | $232.04 | $91,938.23 |
| 148 | Apr 30, 2037 | $1,109.20 | $879.35 | $229.85 | $91,058.88 |
| 149 | May 31, 2037 | $1,109.20 | $881.55 | $227.65 | $90,177.33 |
| 150 | Jun 30, 2037 | $1,109.20 | $883.76 | $225.44 | $89,293.57 |
| 151 | Jul 31, 2037 | $1,109.20 | $885.97 | $223.23 | $88,407.60 |
| 152 | Aug 31, 2037 | $1,109.20 | $888.18 | $221.02 | $87,519.42 |
| 153 | Sep 30, 2037 | $1,109.20 | $890.40 | $218.80 | $86,629.02 |
| 154 | Oct 31, 2037 | $1,109.20 | $892.63 | $216.57 | $85,736.39 |
| 155 | Nov 30, 2037 | $1,109.20 | $894.86 | $214.34 | $84,841.53 |
| 156 | Dec 31, 2037 | $1,109.20 | $897.10 | $212.10 | $83,944.43 |
| Year 2037 | $13,310.40 | $10,618.72 | $2,691.68 | $83,944.43 | |
| 157 | Jan 31, 2038 | $1,109.20 | $899.34 | $209.86 | $83,045.09 |
| 158 | Feb 28, 2038 | $1,109.20 | $901.59 | $207.61 | $82,143.50 |
| 159 | Mar 31, 2038 | $1,109.20 | $903.84 | $205.36 | $81,239.66 |
| 160 | Apr 30, 2038 | $1,109.20 | $906.10 | $203.10 | $80,333.56 |
| 161 | May 31, 2038 | $1,109.20 | $908.37 | $200.83 | $79,425.19 |
| 162 | Jun 30, 2038 | $1,109.20 | $910.64 | $198.56 | $78,514.55 |
| 163 | Jul 31, 2038 | $1,109.20 | $912.91 | $196.29 | $77,601.64 |
| 164 | Aug 31, 2038 | $1,109.20 | $915.20 | $194.00 | $76,686.44 |
| 165 | Sep 30, 2038 | $1,109.20 | $917.48 | $191.72 | $75,768.96 |
| 166 | Oct 31, 2038 | $1,109.20 | $919.78 | $189.42 | $74,849.18 |
| 167 | Nov 30, 2038 | $1,109.20 | $922.08 | $187.12 | $73,927.10 |
| 168 | Dec 31, 2038 | $1,109.20 | $924.38 | $184.82 | $73,002.72 |
| Year 2038 | $13,310.40 | $10,941.71 | $2,368.69 | $73,002.72 | |
| 169 | Jan 31, 2039 | $1,109.20 | $926.69 | $182.51 | $72,076.03 |
| 170 | Feb 28, 2039 | $1,109.20 | $929.01 | $180.19 | $71,147.02 |
| 171 | Mar 31, 2039 | $1,109.20 | $931.33 | $177.87 | $70,215.69 |
| 172 | Apr 30, 2039 | $1,109.20 | $933.66 | $175.54 | $69,282.03 |
| 173 | May 31, 2039 | $1,109.20 | $935.99 | $173.21 | $68,346.04 |
| 174 | Jun 30, 2039 | $1,109.20 | $938.33 | $170.87 | $67,407.71 |
| 175 | Jul 31, 2039 | $1,109.20 | $940.68 | $168.52 | $66,467.03 |
| 176 | Aug 31, 2039 | $1,109.20 | $943.03 | $166.17 | $65,524.00 |
| 177 | Sep 30, 2039 | $1,109.20 | $945.39 | $163.81 | $64,578.61 |
| 178 | Oct 31, 2039 | $1,109.20 | $947.75 | $161.45 | $63,630.86 |
| 179 | Nov 30, 2039 | $1,109.20 | $950.12 | $159.08 | $62,680.74 |
| 180 | Dec 31, 2039 | $1,109.20 | $952.50 | $156.70 | $61,728.24 |
| Year 2039 | $13,310.40 | $11,274.48 | $2,035.92 | $61,728.24 | |
| 181 | Jan 31, 2040 | $1,109.20 | $954.88 | $154.32 | $60,773.36 |
| 182 | Feb 28, 2040 | $1,109.20 | $957.27 | $151.93 | $59,816.09 |
| 183 | Mar 31, 2040 | $1,109.20 | $959.66 | $149.54 | $58,856.43 |
| 184 | Apr 30, 2040 | $1,109.20 | $962.06 | $147.14 | $57,894.37 |
| 185 | May 31, 2040 | $1,109.20 | $964.46 | $144.74 | $56,929.91 |
| 186 | Jun 30, 2040 | $1,109.20 | $966.88 | $142.32 | $55,963.03 |
| 187 | Jul 31, 2040 | $1,109.20 | $969.29 | $139.91 | $54,993.74 |
| 188 | Aug 31, 2040 | $1,109.20 | $971.72 | $137.48 | $54,022.02 |
| 189 | Sep 30, 2040 | $1,109.20 | $974.14 | $135.06 | $53,047.88 |
| 190 | Oct 31, 2040 | $1,109.20 | $976.58 | $132.62 | $52,071.30 |
| 191 | Nov 30, 2040 | $1,109.20 | $979.02 | $130.18 | $51,092.28 |
| 192 | Dec 31, 2040 | $1,109.20 | $981.47 | $127.73 | $50,110.81 |
| Year 2040 | $13,310.40 | $11,617.43 | $1,692.97 | $50,110.81 | |
| 193 | Jan 31, 2041 | $1,109.20 | $983.92 | $125.28 | $49,126.89 |
| 194 | Feb 28, 2041 | $1,109.20 | $986.38 | $122.82 | $48,140.51 |
| 195 | Mar 31, 2041 | $1,109.20 | $988.85 | $120.35 | $47,151.66 |
| 196 | Apr 30, 2041 | $1,109.20 | $991.32 | $117.88 | $46,160.34 |
| 197 | May 31, 2041 | $1,109.20 | $993.80 | $115.40 | $45,166.54 |
| 198 | Jun 30, 2041 | $1,109.20 | $996.28 | $112.92 | $44,170.26 |
| 199 | Jul 31, 2041 | $1,109.20 | $998.77 | $110.43 | $43,171.49 |
| 200 | Aug 31, 2041 | $1,109.20 | $1,001.27 | $107.93 | $42,170.22 |
| 201 | Sep 30, 2041 | $1,109.20 | $1,003.77 | $105.43 | $41,166.45 |
| 202 | Oct 31, 2041 | $1,109.20 | $1,006.28 | $102.92 | $40,160.17 |
| 203 | Nov 30, 2041 | $1,109.20 | $1,008.80 | $100.40 | $39,151.37 |
| 204 | Dec 31, 2041 | $1,109.20 | $1,011.32 | $97.88 | $38,140.05 |
| Year 2041 | $13,310.40 | $11,970.76 | $1,339.64 | $38,140.05 | |
| 205 | Jan 31, 2042 | $1,109.20 | $1,013.85 | $95.35 | $37,126.20 |
| 206 | Feb 28, 2042 | $1,109.20 | $1,016.38 | $92.82 | $36,109.82 |
| 207 | Mar 31, 2042 | $1,109.20 | $1,018.93 | $90.27 | $35,090.89 |
| 208 | Apr 30, 2042 | $1,109.20 | $1,021.47 | $87.73 | $34,069.42 |
| 209 | May 31, 2042 | $1,109.20 | $1,024.03 | $85.17 | $33,045.39 |
| 210 | Jun 30, 2042 | $1,109.20 | $1,026.59 | $82.61 | $32,018.80 |
| 211 | Jul 31, 2042 | $1,109.20 | $1,029.15 | $80.05 | $30,989.65 |
| 212 | Aug 31, 2042 | $1,109.20 | $1,031.73 | $77.47 | $29,957.92 |
| 213 | Sep 30, 2042 | $1,109.20 | $1,034.31 | $74.89 | $28,923.61 |
| 214 | Oct 31, 2042 | $1,109.20 | $1,036.89 | $72.31 | $27,886.72 |
| 215 | Nov 30, 2042 | $1,109.20 | $1,039.48 | $69.72 | $26,847.24 |
| 216 | Dec 31, 2042 | $1,109.20 | $1,042.08 | $67.12 | $25,805.16 |
| Year 2042 | $13,310.40 | $12,334.89 | $975.51 | $25,805.16 | |
| 217 | Jan 31, 2043 | $1,109.20 | $1,044.69 | $64.51 | $24,760.47 |
| 218 | Feb 28, 2043 | $1,109.20 | $1,047.30 | $61.90 | $23,713.17 |
| 219 | Mar 31, 2043 | $1,109.20 | $1,049.92 | $59.28 | $22,663.25 |
| 220 | Apr 30, 2043 | $1,109.20 | $1,052.54 | $56.66 | $21,610.71 |
| 221 | May 31, 2043 | $1,109.20 | $1,055.17 | $54.03 | $20,555.54 |
| 222 | Jun 30, 2043 | $1,109.20 | $1,057.81 | $51.39 | $19,497.73 |
| 223 | Jul 31, 2043 | $1,109.20 | $1,060.46 | $48.74 | $18,437.27 |
| 224 | Aug 31, 2043 | $1,109.20 | $1,063.11 | $46.09 | $17,374.16 |
| 225 | Sep 30, 2043 | $1,109.20 | $1,065.76 | $43.44 | $16,308.40 |
| 226 | Oct 31, 2043 | $1,109.20 | $1,068.43 | $40.77 | $15,239.97 |
| 227 | Nov 30, 2043 | $1,109.20 | $1,071.10 | $38.10 | $14,168.87 |
| 228 | Dec 31, 2043 | $1,109.20 | $1,073.78 | $35.42 | $13,095.09 |
| Year 2043 | $13,310.40 | $12,710.07 | $600.33 | $13,095.09 | |
| 229 | Jan 31, 2044 | $1,109.20 | $1,076.46 | $32.74 | $12,018.63 |
| 230 | Feb 28, 2044 | $1,109.20 | $1,079.15 | $30.05 | $10,939.48 |
| 231 | Mar 31, 2044 | $1,109.20 | $1,081.85 | $27.35 | $9,857.63 |
| 232 | Apr 30, 2044 | $1,109.20 | $1,084.56 | $24.64 | $8,773.07 |
| 233 | May 31, 2044 | $1,109.20 | $1,087.27 | $21.93 | $7,685.80 |
| 234 | Jun 30, 2044 | $1,109.20 | $1,089.99 | $19.21 | $6,595.81 |
| 235 | Jul 31, 2044 | $1,109.20 | $1,092.71 | $16.49 | $5,503.10 |
| 236 | Aug 31, 2044 | $1,109.20 | $1,095.44 | $13.76 | $4,407.66 |
| 237 | Sep 30, 2044 | $1,109.20 | $1,098.18 | $11.02 | $3,309.48 |
| 238 | Oct 31, 2044 | $1,109.20 | $1,100.93 | $8.27 | $2,208.55 |
| 239 | Nov 30, 2044 | $1,109.20 | $1,103.68 | $5.52 | $1,104.87 |
| 240 | Dec 31, 2044 | $1,107.63 | $1,104.87 | $2.76 | $0.00 |
| Year 2044 | $13,308.83 | $13,095.09 | $213.74 | $0.00 |
In Summary
A 20-year fixed-rate mortgage is ideal for buyers who want a shorter term but cannot afford a 15-year fixed-rate loan. This is a great option if you don’t want very high monthly payments. It’s also good if you want to remove 10-years off a 30-year term. Though payments in a 20-year fixed term is higher, it is not as expensive as a 15 or 10-year home loan.
Furthermore, you can refinance to a 20-year fixed mortgage if you cannot afford a shorter term. Just be sure to refinance within a few years of your mortgage to make the most of its benefits. It’s also important to time refinancing with lower rates. Finally, be sure to improve your credit score before refinancing to qualify for more competitive rates.